Hi All and @alainmazy ,
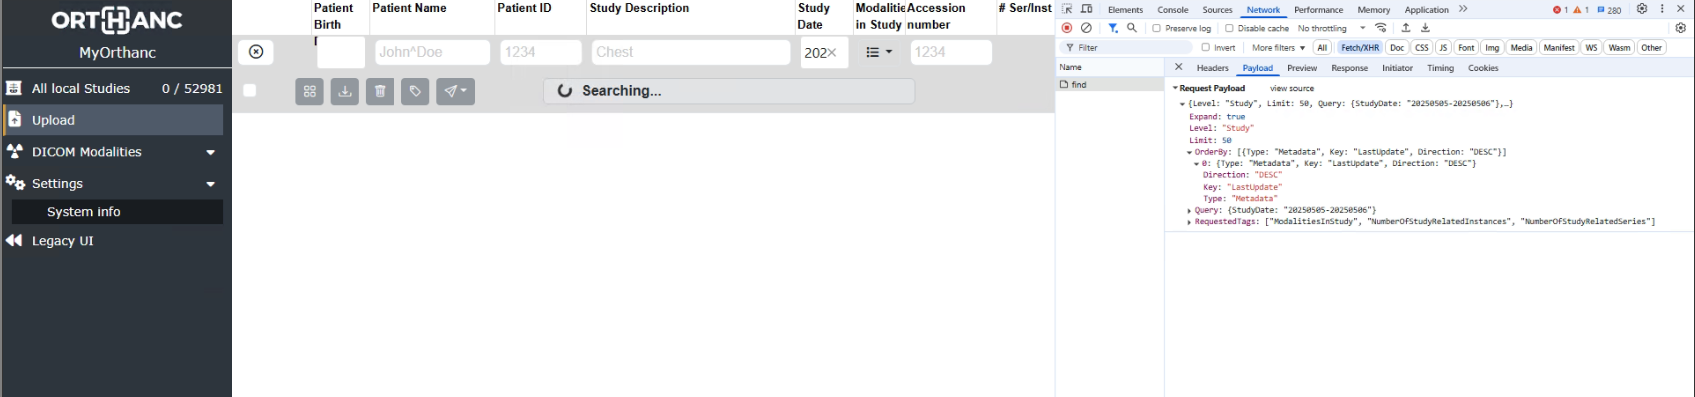
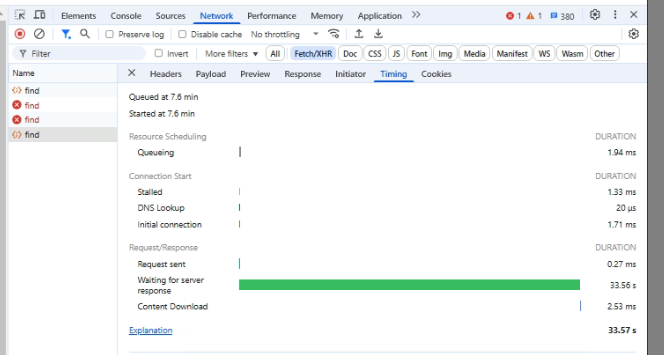
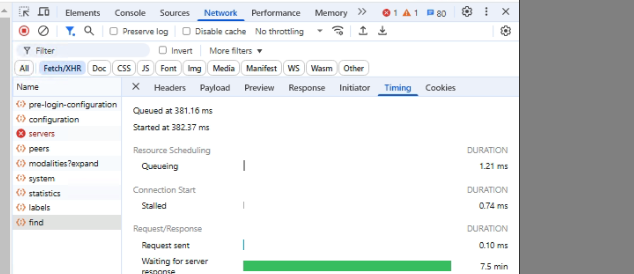
Do you guys have experienced that Orthanc OE2 return query very slow ? With this simple search by date rage, it took more than 30 seconds (sometimes it took several minutes) to display the result ?
This is statistics of my Orthanc
{
   "CountInstances" : 8046517,
   "CountPatients" : 29856,
   "CountSeries" : 168839,
   "CountStudies" : 53422,
   "TotalDiskSize" : "6443366622921",
   "TotalDiskSizeMB" : 6144873,
   "TotalUncompressedSize" : "6443366622921",
   "TotalUncompressedSizeMB" : 6144873
}
I do not think it’s too much instances. In the verbose log , it just only see
I0509 15:50:02.130019 HTTP-27 HttpServer.cpp:1263] (http) POST /tools/find
I am using the Orthanc Team Docker version : orthancteam/orthanc:25.4.0-full
I already follow the optimization guide for Postgres in Scalability of Orthanc — Orthanc Book documentation , but the query is still slow
This is my orthanc configuration
{
  "Name": "MyOrthanc",
  "StorageDirectory": "/var/lib/orthanc/db",
  "DelayedDeletion": {
    "Enable": true,
    "ThrottleDelayMs": 0,
    "Path": "/var/lib/orthanc/db/delayed-deletion-1.db"
  },
  "IndexDirectory": "/var/lib/orthanc/db",
  "StorageCompression": false,
  "MaximumStorageSize": 0,
  "MaximumPatientCount": 0,
  "MaximumStorageMode": "Recycle",
  "MaximumStorageCacheSize": 128,
  "LuaScripts": [
    "/lua-scripts/MyScript.lua"
  ],
  "LuaHeartBeatPeriod": 0,
  "PostgreSQL": {
    "EnableIndex": true,
    "EnableStorage": false,
    "Lock": false,
    "Host": "orthanc-ct-mr-2025-db",
    "Port": 5432,
    "Database": "orthanc",
    "Username": "postgres",
    "Password": "orthanc",
    "EnableSsl": false,
    "MaximumConnectionRetries": 10,
    "ConnectionRetryInterval": 10,
    "IndexConnectionsCount": 20,
    "EnableVerboseLogs": false,
    "TransactionMode": "ReadCommitted"
  },
  "Java": {
    "Enabled": true,
    "Classpath": "/java/OrthancJavaSDK.jar:/java/target/OrthancJavaPlugin-1.0.1-jar-with-dependencies.jar",
    "InitializationClass": "Main",
    "Enable": true
  },
    "DicomWeb": {
    "Enable": true,
    "Root": "/wado-rs/",
    "EnableWado": true,
    "WadoRoot": "/wado",
    "Ssl": false,
    "QidoCaseSensitive": true,
    "Host": "",
    "StudiesMetadata": "Full",
    "SeriesMetadata": "Full",
    "EnableMetadataCache": true,
    "MetadataWorkerThreadsCount": 4,
    "PublicRoot": "/dicom-web/"
  },
  "Transfers": {
    "Threads": 6,
    "BucketSize": 4096,
    "CacheSize": 512,
    "MaxPushTransactions": 20,
    "MaxHttpRetries": 10,
    "PeerConnectivityTimeout": 120
  },
  "OrthancExplorer2": {
    "Enable": true,
    "IsDefaultOrthancUI": true,
    "UiOptions": {
      "ViewersOrdering": [
        "ohif",
        "wsi"
      ],
      "OhifViewer3PublicRoot": "/saola/"
    }
  },
  "OHIF": {
    "DataSource": "wado-rs"
  },
  "OrthancPeers": {
    "peer": {
      "Url": "http://27.72.147.196:8042/",
      "Username": "orthanc",
      "Password": "orthanc",
      "Timeout": 1
    }
  },
  "ConcurrentJobs": 10,
  "JobsEngineThreadsCount": {
    "ResourceModification": 1
  },
  "HttpServerEnabled": true,
  "OrthancExplorerEnabled": true,
  "HttpPort": 8042,
  "HttpDescribeErrors": true,
  "HttpCompressionEnabled": false,
  "WebDavEnabled": true,
  "WebDavDeleteAllowed": false,
  "WebDavUploadAllowed": true,
  "DicomServerEnabled": true,
  "DicomAet": "ORTHANC",
  "DicomCheckCalledAet": false,
  "DicomPort": 4242,
  "DefaultEncoding": "Latin1",
  "AcceptedTransferSyntaxes": [
    "1.2.840.10008.1.*"
  ],
  "UnknownSopClassAccepted": false,
  "DicomScpTimeout": 30,
  "RemoteAccessAllowed": true,
  "SslEnabled": false,
  "SslCertificate": "certificate.pem",
  "SslMinimumProtocolVersion": 4,
  "SslVerifyPeers": false,
  "SslTrustedClientCertificates": "trustedClientCertificates.pem",
  "AuthenticationEnabled": true,
  "RegisteredUsers": {
    "orthanc": "orthanc"
  },
  "DicomTlsEnabled": false,
  "DicomTlsRemoteCertificateRequired": true,
  "DicomTlsMinimumProtocolVersion": 0,
  "DicomAlwaysAllowEcho": true,
  "DicomAlwaysAllowStore": true,
  "DicomAlwaysAllowFind": false,
  "DicomAlwaysAllowFindWorklist": false,
  "DicomAlwaysAllowGet": false,
  "DicomAlwaysAllowMove": false,
  "DicomCheckModalityHost": false,
  "DicomModalities": {
    "SELF": [
      "SELF",
      "localhost",
      4242
    ]
  },
  "DicomModalitiesInDatabase": false,
  "DicomEchoChecksFind": false,
  "DicomScuTimeout": 10,
  "DicomScuPreferredTransferSyntax": "1.2.840.10008.1.2.1",
  "DicomThreadsCount": 4,
  "OrthancPeersInDatabase": false,
  "HttpProxy": "",
  "HttpVerbose": false,
  "HttpTimeout": 60,
  "HttpsVerifyPeers": true,
  "HttpsCACertificates": "",
  "UserMetadata": {},
  "UserContentType": {},
  "StableAge": 2,
  "StrictAetComparison": false,
  "StoreMD5ForAttachments": true,
  "LimitFindResults": 100,
  "LimitFindInstances": 100,
  "LogExportedResources": false,
  "KeepAlive": true,
  "KeepAliveTimeout": 1,
  "TcpNoDelay": true,
  "HttpThreadsCount": 100,
  "StoreDicom": true,
  "DicomAssociationCloseDelay": 5,
  "QueryRetrieveSize": 100,
  "CaseSensitivePN": false,
  "LoadPrivateDictionary": true,
  "Dictionary": {},
  "SynchronousCMove": true,
  "JobsHistorySize": 1000,
  "SaveJobs": true,
  "OverwriteInstances": true,
  "MediaArchiveSize": 1,
  "StorageAccessOnFind": "Never",
  "MetricsEnabled": true,
  "ExecuteLuaEnabled": false,
  "RestApiWriteToFileSystemEnabled": false,
  "HttpRequestTimeout": 30,
  "DefaultPrivateCreator": "",
  "StorageCommitmentReportsSize": 100,
  "TranscodeDicomProtocol": true,
  "BuiltinDecoderTranscoderOrder": "After",
  "IngestTranscodingOfUncompressed": true,
  "IngestTranscodingOfCompressed": true,
  "DicomLossyTranscodingQuality": 90,
  "SyncStorageArea": true,
  "MallocArenaMax": 5,
  "DeidentifyLogs": true,
  "DeidentifyLogsDicomVersion": "2023b",
  "MaximumPduLength": 16384,
  "DatabaseServerIdentifier": "Orthanc1",
  "CheckRevisions": false,
  "SynchronousZipStream": true,
  "ZipLoaderThreads": 0,
  "Warnings": {
    "W001_TagsBeingReadFromStorage": true,
    "W002_InconsistentDicomTagsInDb": true
  },
  "Plugins": [
    "/run/orthanc/plugins",
    "/usr/share/orthanc/plugins"
  ],
  "Gdcm": {
    "Throttling": 4,
    "RestrictTransferSyntaxes": [
      "1.2.840.10008.1.2.4.90",
      "1.2.840.10008.1.2.4.91",
      "1.2.840.10008.1.2.4.92",
      "1.2.840.10008.1.2.4.93"
    ]
  }
}