Hi,
Since a change in the algorithm of the display I get a different (and wrong) rendering of the structure sets for some my datasets (but not all). So far I did not find a pattern for the Dicom data or structure shape causing the problem.
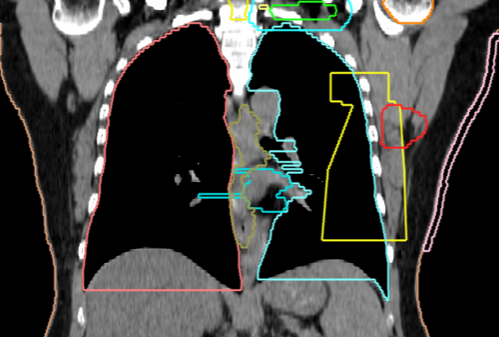
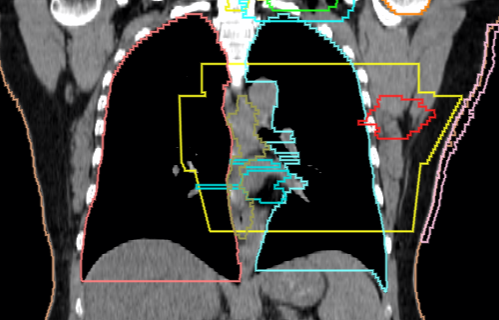
Below is an example of the difference of rendering before and after revf81cdf283859 on Stone.
Has anyone else got the same issue? With luckily a pattern in the data that is badly rendered.
I looked quickly at the positions of the contour but did not see anything particular (although it’s not easy to interpret).
Before

After
