Increase in CPU usage of database after update to orthanc 1.12.7

Hi, yesterday we upgrade our Orthanc instance from the docker orthancteam/orthanc 24.9.1 to 25.4.2, including the update to orthanc 1.12.7 and the Orthanc SQL plugin.

After this, we are measuring a notable increase in the response time of some queries. Last monday avg response time was below 1 second, and now over 10 seconds. There request include:

/dicom-web/studies?limit=101&offset=0&fuzzymatching=false&includefield=00081030%2C00080060&StudyInstanceUID=REDACTED

and

/dicom-web/studies?00100020=*REDACTED*&limit=101&offset=0&fuzzymatching=false&includefield=00081030%2C00080060.

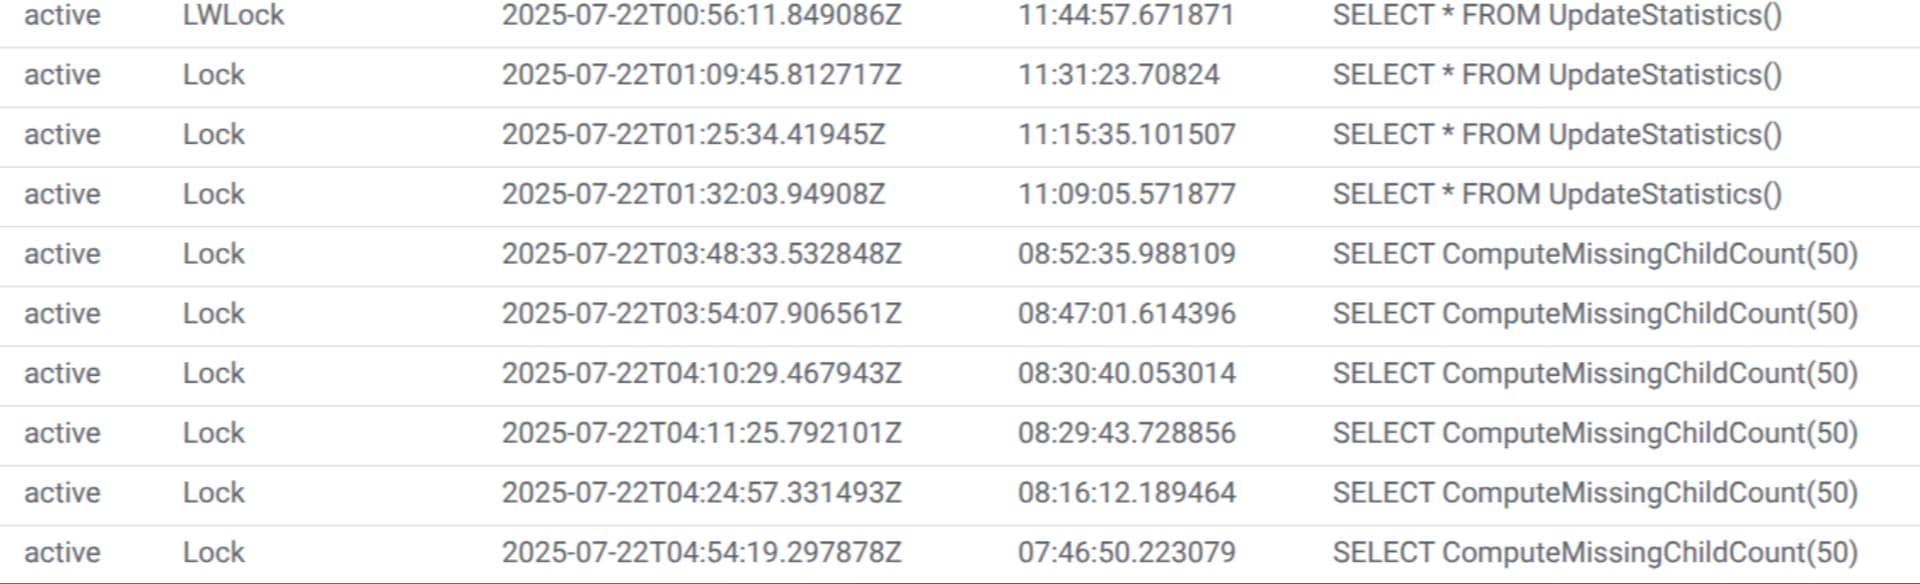
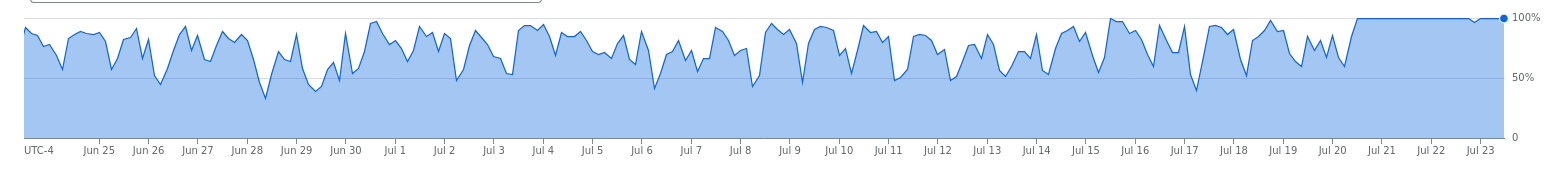
At the same time, we see an increase in the CPU usage of the database, in this case, Postgres Google Cloud SQL. Right now, it keeps at 100% for about 12 hours.

I include an incomplete orthanc.json file:

orthanc.json
{
  "Name": "Orthanc Incoming",
  "StorageDirectory": "/var/lib/orthanc/db",
  "IndexDirectory": "/var/lib/orthanc/db",
  "TemporaryDirectory": "/tmp/orthanc/",
  "StorageCompression": true,
  "MaximumStorageSize": 0,
  "MaximumStorageCacheSize": 0,
  "ZipLoaderThreads": 4,
  "ExtraMainDicomTags": {
    "Instance": [
      "Rows",
      "Columns",
      "ImageType",
      "SOPClassUID",
      "ContentDate",
      "ContentTime",
      "FrameOfReferenceUID",
      "PixelSpacing",
      "SpecificCharacterSet",
      "BitsAllocated"
    ],
    "Series": [],
    "Study": [],
    "Patient": []
  },
  "Warnings": {
    "W001_TagsBeingReadFromStorage": true,
    "W002_InconsistentDicomTagsInDb": false
  },
  "MaximumPatientCount": 0,
  "LuaScripts": [],
  "Plugins": [
    "/usr/share/orthanc/plugins",
    "/usr/local/share/orthanc/plugins"
  ],
  "ConcurrentJobs": 40,
  "HttpServerEnabled": true,
  "HttpDescribeErrors": true,
  "HttpCompressionEnabled": true,
  "DicomServerEnabled": true,
  "DicomCheckCalledAet": false,
  "DefaultEncoding": "Latin1",
  "DeflatedTransferSyntaxAccepted": true,
  "JpegTransferSyntaxAccepted": true,
  "Jpeg2000TransferSyntaxAccepted": true,
  "JpegLosslessTransferSyntaxAccepted": true,
  "JpipTransferSyntaxAccepted": true,
  "Mpeg2TransferSyntaxAccepted": true,
  "RleTransferSyntaxAccepted": true,
  "UnknownSopClassAccepted": false,
  "DicomScpTimeout": 120,
  "DicomModalities": {},
  "DicomModalitiesInDatabase": true,
  "DicomAlwaysAllowEcho": true,
  "DicomAlwaysAllowStore": true,
  "DicomCheckModalityHost": false,
  "DicomScuTimeout": 120,
  "OrthancPeers": {},
  "OrthancPeersInDatabase": false,
  "HttpProxy": "",
  "HttpVerbose": false,
  "HttpTimeout": 600,
  "HttpsVerifyPeers": true,
  "HttpsCACertificates": "/etc/ssl/certs/ca-certificates.crt",
  "UserMetadata": {},
  "UserContentType": {},
  "StableAge": 60,
  "StrictAetComparison": false,
  "StoreMD5ForAttachments": true,
  "LimitFindResults": 100,
  "LimitFindInstances": 100,
  "LogExportedResources": false,
  "KeepAlive": true,
  "TcpNoDelay": true,
  "HttpThreadsCount": 200,
  "DicomThreadsCount": 100,
  "StoreDicom": true,
  "DicomAssociationCloseDelay": 5,
  "QueryRetrieveSize": 200,
  "CaseSensitivePN": false,
  "LoadPrivateDictionary": true,
  "Dictionary": {},
  "SynchronousCMove": true,
  "JobsHistorySize": 1000,
  "SaveJobs": false,
  "OverwriteInstances": false,
  "MediaArchiveSize": 15,
  "StorageAccessOnFind": "Never",
  "MetricsEnabled": true,
  "DatabaseServerIdentifier": "@@@DATABASE_SERVER_IDENTIFIER@@@",
  "PostgreSQL": {
    "EnableIndex": true,
    "EnableStorage": false,
    "IndexConnectionsCount": 50,
    "Host": "@@@POSTGRES_HOST@@@",
    "Port": 5432,
    "TransactionMode": "ReadCommitted",
    "Database": "@@@POSTGRES_DB@@@",
    "Username": "@@@POSTGRES_USER@@@",
    "Password": "@@@POSTGRES_PASSWORD@@@"
  },
  "DicomWeb": {}
}

Do you have some intution to where is this problem coming from? Maybe is there a way to fix this behaviour before we can find a final solution?

We are eager to provide further information.

Thanks

Hi, we keep looking into this issue, and we found some queries running for over 8 hours in the db, related to Housekeeping. We think that this be related to the change in PostgreSQL plugin v7:

Introduced a new thread to perform DB Housekeeping at regular interval.  
  E.g: This avoids very long update times in case you don't call /statistics 
  for a long period.  The execution interval of this thread can be configured 
  through "HousekeepingInterval" (default: 1s).

An incomplete list of last queries in out db, note the fourth column showing the duration:

Now, we are disabling the plugin hoping for this cpu usage to return to normal values.

We are not sure where the ComputeMissingChildCount query come from yet.

Well, these functions are supposed to take a few milliseconds to execute - not hours. You’ll see in the code that they are pretty simple.

There must be something special with your DB… you may try to execute them directly in psql and analyze the tables they are using in order to understand what’s going on in your DB.

Hi, I want to update with the information we were able to get since sunday.

First, some information about the setup. The database is a PostgreSQL running of Google Cloud SQL. Right now that machine has 8v cpu and 32g ram. We upgraded this on monday from 2v cpu and 8 gb of ram trying to solve this issue.

This is cpu usage of the last 30 days:

The amount of users, daily new studies, or behaviuor of our users have not changed.

We keep in our main database over 7 million orthanc resources. Daily, we erase the studies older than some days, we keep backups elsewhere.

As noted in the previuos post, we found these UpdateStatistics function taking over 10 hours to complete. We disable the function changing the value of the housekeeping to 24h. After this, we noted some minor change in the cpu usage.

Our biggest problem right now, is we need to remove over 2000 studies daily. This process normally take 4 hours to complete. But now it takes over 12 hours with 4 times the db resources. In fact, since sunday, this daily process could not finish completely, we have to stop it to release resources to normal usage. We are seeing that some DeleteResource execution takes over 1 hour.

Checking the code of this update, we found that the DeleteResource function has been updated, we are currently checking the actual changes and the impact it might have produced.

Hi,

You mean 7M instances or 7M studies ? 7M instances is not big at all compared to other DBs, 7M studies is actually huge !

Note that we have again updated the DeleteResource function in the next release that is available in the orthancteam/orthanc-pre-release:sql-opti-unstable. It might be interesting to give it a try but not on a production environment since it might not be the final Rev6 schema.

Note that, at worst case, you can still revert to previous schema: PostgreSQL plugins — Orthanc Book documentation

Best,

Alain

Hi Alain,

I’m Vicente’s colleague. We identified the root cause of the problem as a large accumulation of InvalidChildCounts entries that needed to be deleted in cascade. After adding an index on InvalidChildCounts(id), the issue was resolved.

We also observed a similar pattern with GlobalIntegersChanges during the execution of UpdateStatistics. When this function isn’t run periodically, the accumulated entries can grow to a point where the first execution causes the database to crash due to resource exhaustion.

Based on our experience, I would recommend the following improvements for future versions:

  1. Add an index on InvalidChildCounts(id) to speed up deletions.
  2. Introduce a LIMIT in the DELETE query within UpdateSingleStatistic to process GlobalIntegersChanges in smaller, manageable batches.

For context, in our case:

  • UpdateStatistics took around 12 hours before we had to manually terminate it to free up database CPU.
  • DeleteResource was taking between 3 and 15 minutes per execution.

After applying the above optimizations, both operations now complete in just a few seconds.

Best regards,
Rafik

1 Like

Hi @rmasad

Thanks a lot for the heads up !

I have implemented your proposal in the mainline: orthanc-databases: 9734488b55c0

Can you check if this is similar to what you have done ? Or suggest a smarter way to implement the LIMIT in the DELETE statement ?

CREATE OR REPLACE FUNCTION UpdateSingleStatistic(
    IN statistics_key INTEGER,
    OUT new_value BIGINT
) AS $body$
BEGIN

  -- Delete the current changes, sum them and update the GlobalIntegers row.
  -- New rows can be added in the meantime, they won't be deleted or summed.
  WITH rows_to_delete AS (
    SELECT ctid
    FROM GlobalIntegersChanges
    WHERE GlobalIntegersChanges.key = statistics_key
    LIMIT 10000                  -- by default, the UpdateSingleStatistics is called every seconds -> we should never get more than 10000 entries to compute so this is mainly useful to catch up with long standing entries from previous plugins version without the Housekeeping thread
  ), 
  deleted_rows AS (
      DELETE FROM GlobalIntegersChanges
      WHERE GlobalIntegersChanges.ctid IN (SELECT ctid FROM rows_to_delete)
      RETURNING value
  )
  UPDATE GlobalIntegers
  SET value = value + (
      SELECT COALESCE(SUM(value), 0)
      FROM deleted_rows
  )
  WHERE GlobalIntegers.key = statistics_key
  RETURNING value INTO new_value;

END;
$body$ LANGUAGE plpgsql;

We are planning the next PostgreSQL plugin hopefully this week so that would be great if you can provide us with feedback quite rapidly.

Best regards,

Alain

Thanks, Alain. These are exactly the changes we made.

My only question is about the size limit and how long it would take to run with 10,000 data points. I don’t know if you’ve done any tests.

Thanks for your feedback.

Summing 10.000 rows should really take only a few milliseconds and, in normal conditions, you’ll likely have only a few hundreds rows to sum.
You’ll only have millions of rows to sum when you upgrade from an old plugin that did not have the housekeeping thread active.

Thank you for implementing the suggested changes and for the great work you do at Orthanc!

Rafik