Hi all,
I am new to Orthanc framework.
I try to make a new plugin that need the transfer accelerator plugin functionalities.
For that purpose I have put the code of the plugin inside mine.
When I post a pull request with one resource, I have the following error : “Bad sequence of calls”. It happens when the code pass in the “**OrthancPlugins::**PullJob” constructor.
Is there any hint about this error?
Other question : Is there a way to communicate between already install orthanc plugins?
If you need more information please let me know.
Kind regards,
Audrey
Hi Audrey,
The Bad Sequence of calls exception can trigger at many places, it always means that there’s some required initialization code that has not been run. Just add a breakpoint and you’ll see what’s missing.
The best way to communicate between plugins is to use the Rest API and use RestApiGetAfterPlugins and its siblings (doc)
HTH
Alain.
Hi Alain,
Thanks a lot, the RestApiPostAfterPlugins solved my problem!
Regards,
Audrey
Hi Alain,
In your previous answer you said I can add a breakpoint in my plugin code.
Is that possible to debug inside a plugin?
For now, I process like this :
-
I have build Orthanc Server on my disk
-
I add the plugin path to my Orthanc Server Configuration.json file
-
I build my c++ plugin
-
I relaunch Orthanc, passing the json configuration file in parameter
I can use gdb but my breakpoints are not fired by vscode.
I am on Ubuntu Jammy Jellyfish.
Can you tell me if there is a documentation about that?
Regards
Audrey
Hi Audrey,
There’s no specific documentation for that. But here’s how I work (I’m also using VSCode).
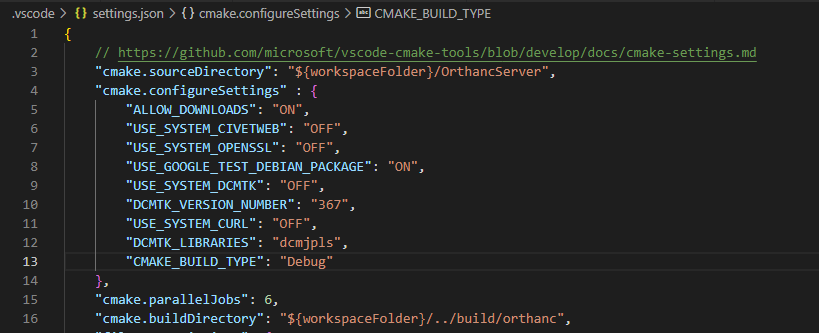
Make sure to build Orthanc and the plugins in Debug. Here’s my settings.json for Orthanc (used by CMake extension):

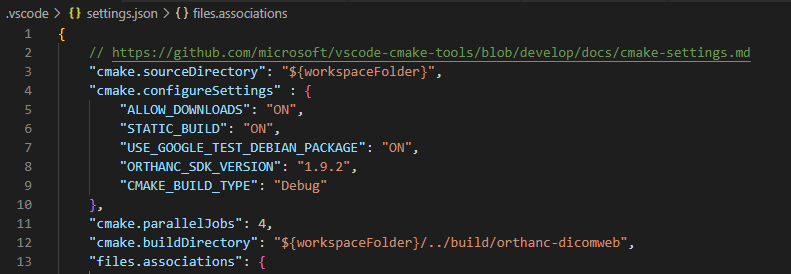
And, the one from my dicom-web plugin:

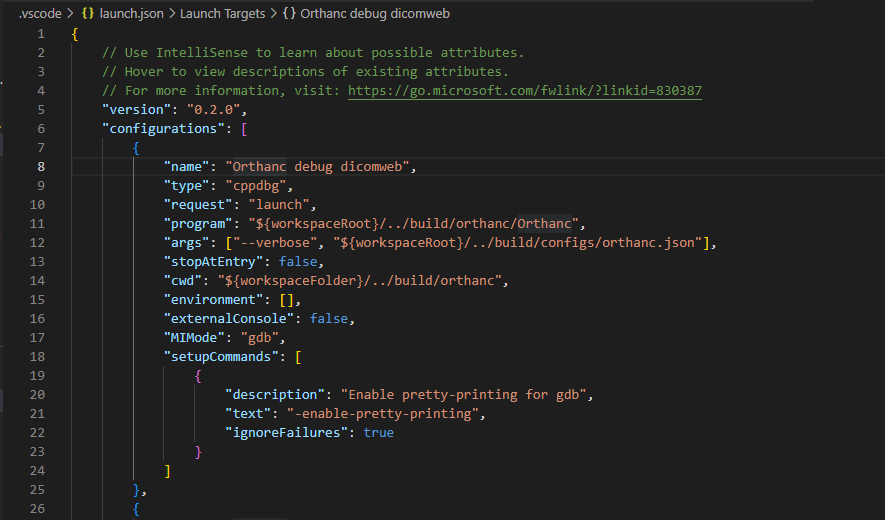
Then, here’s my launch.json for dicom-web plugin:

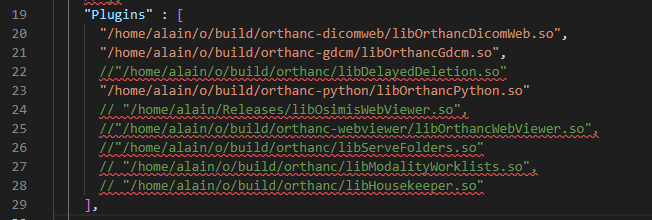
And an extract from my orthanc.json file:

Then, if I set a breakpoint in the dicom-web plugin code and debug from the dicom-web project in VSCode, the debugger stops on my breakpoint.
Note that it seems that the debugger will only stops on breakpoints that you have set in the project you are currently debugging → if you debug the dicom-web plugin, the debugger won’t always stop on breakpoints that you have set in Orthanc. Depending on what I need to debug, I’m launching Orthanc or the plugin project.
HTH
Alain.
Hi Alain,
Thanks a lot for these explanations.
I’ve just tried to reproduce your configuration with my projets.
I have the “ms-vscode.cpptools” installed.
Could you please show me the content of your tasks.json files?
I think my problem is when I build and launch the Orthanc project.
Regards
Audrey
Well, I don’t have a tasks.json file 
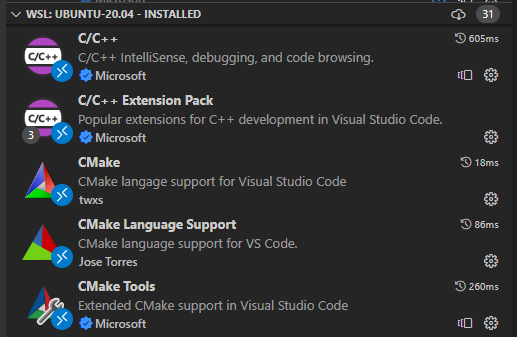
FYI, here are the relevant extensions that I have:

Thanks for your reply.
Now I can debug at same time on Orthanc Server and my plugin!
I have the same C/C++ extensions.
I have now almost the same launch et settings json files as you, expect that :
- I do not use {WorkspaceRoot} variable (for the plugin launch.json) but only WorkspaceFolder
- I’ve defined the “miDebuggerPath” in launch.json
My plugin is in the same workspace as the server.
I had to update my gdb to 12.1 to be able to put breakpoints (issue here).
Regards
Audrey
